| SNP | A single nucleotide polymorphism is a one-letter DNA difference at a specific position in the genome. | It helps compare isolates, track relatedness, detect strain differences, and identify mutations linked to traits such as resistance. |
| SNP ID | The exact position and base change for a SNP. | It gives a precise marker that can be reported, compared across samples, or checked against known mutation databases. |
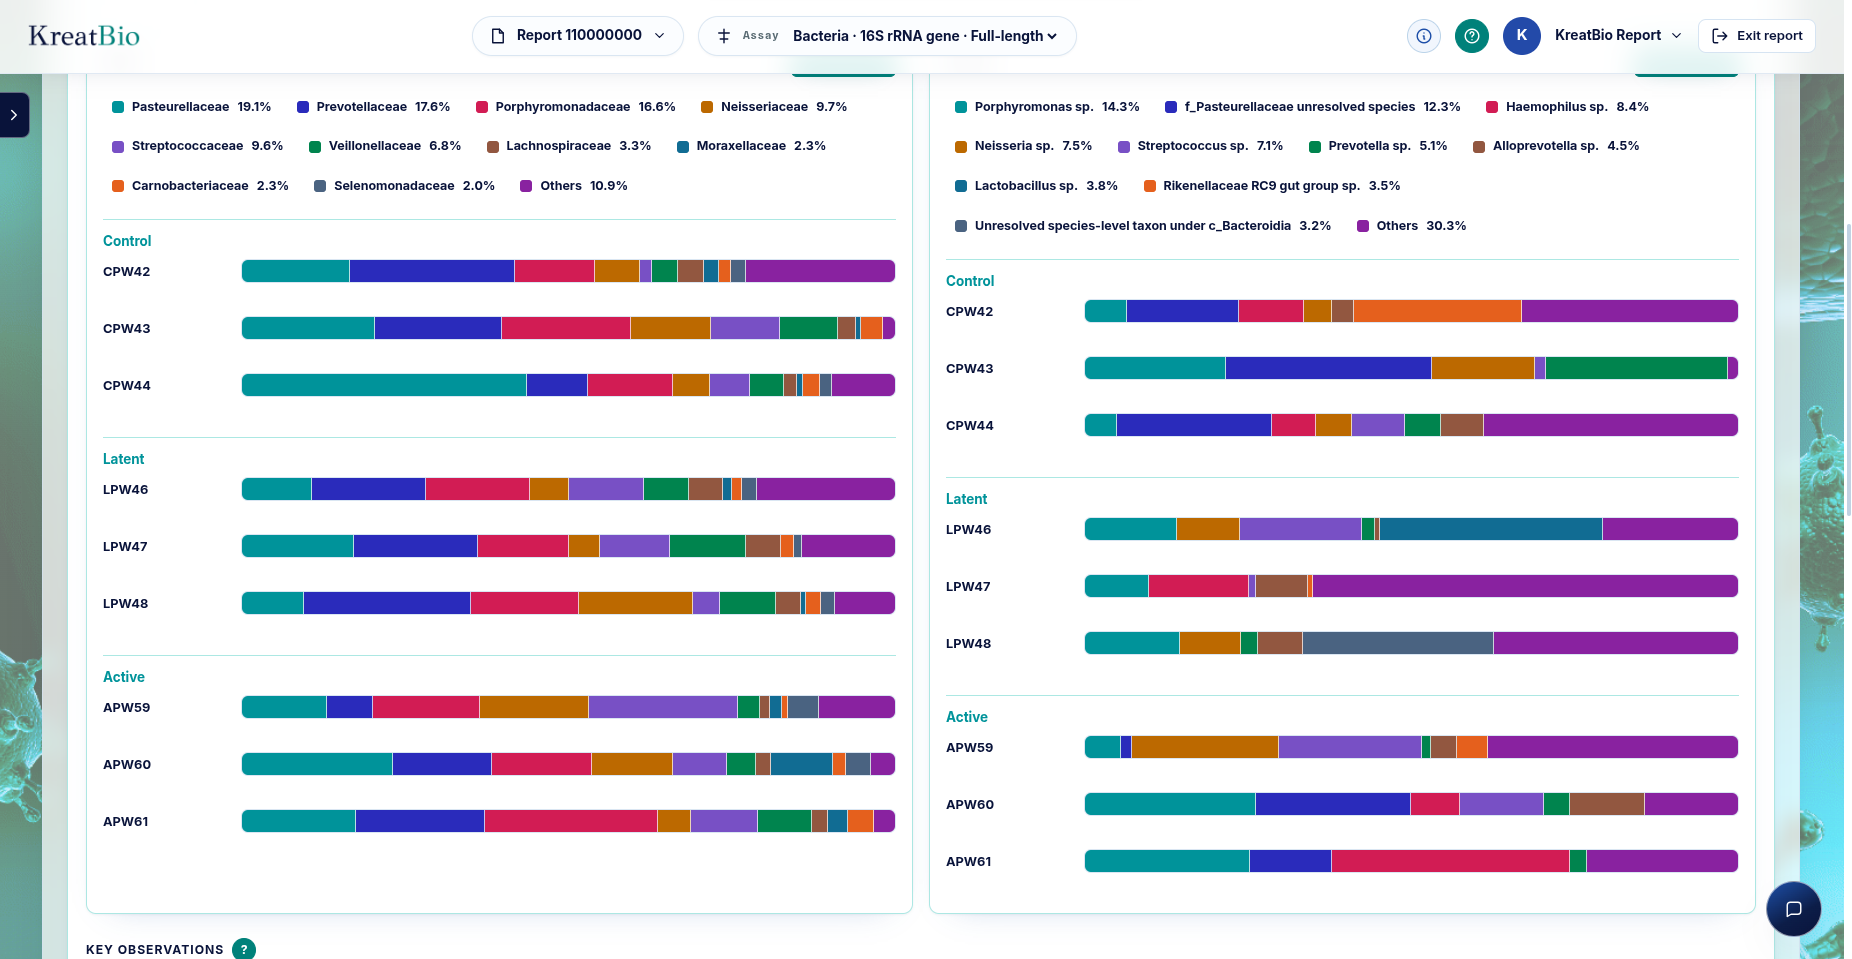
| Abundance bar chart | A stacked chart showing the relative amount of each taxon in each sample. | It quickly shows which bacteria, archaea, or fungi dominate and how community composition differs between samples. |
| Alpha diversity: Observed ASVs/OTUs | The number of unique sequence groups detected in one sample. | It estimates richness: how many different microbes are present. |
| Alpha diversity: Chao1 | A richness estimate that gives extra weight to rare microbes. | It helps estimate how many microbes may be present but were only lightly sampled. |
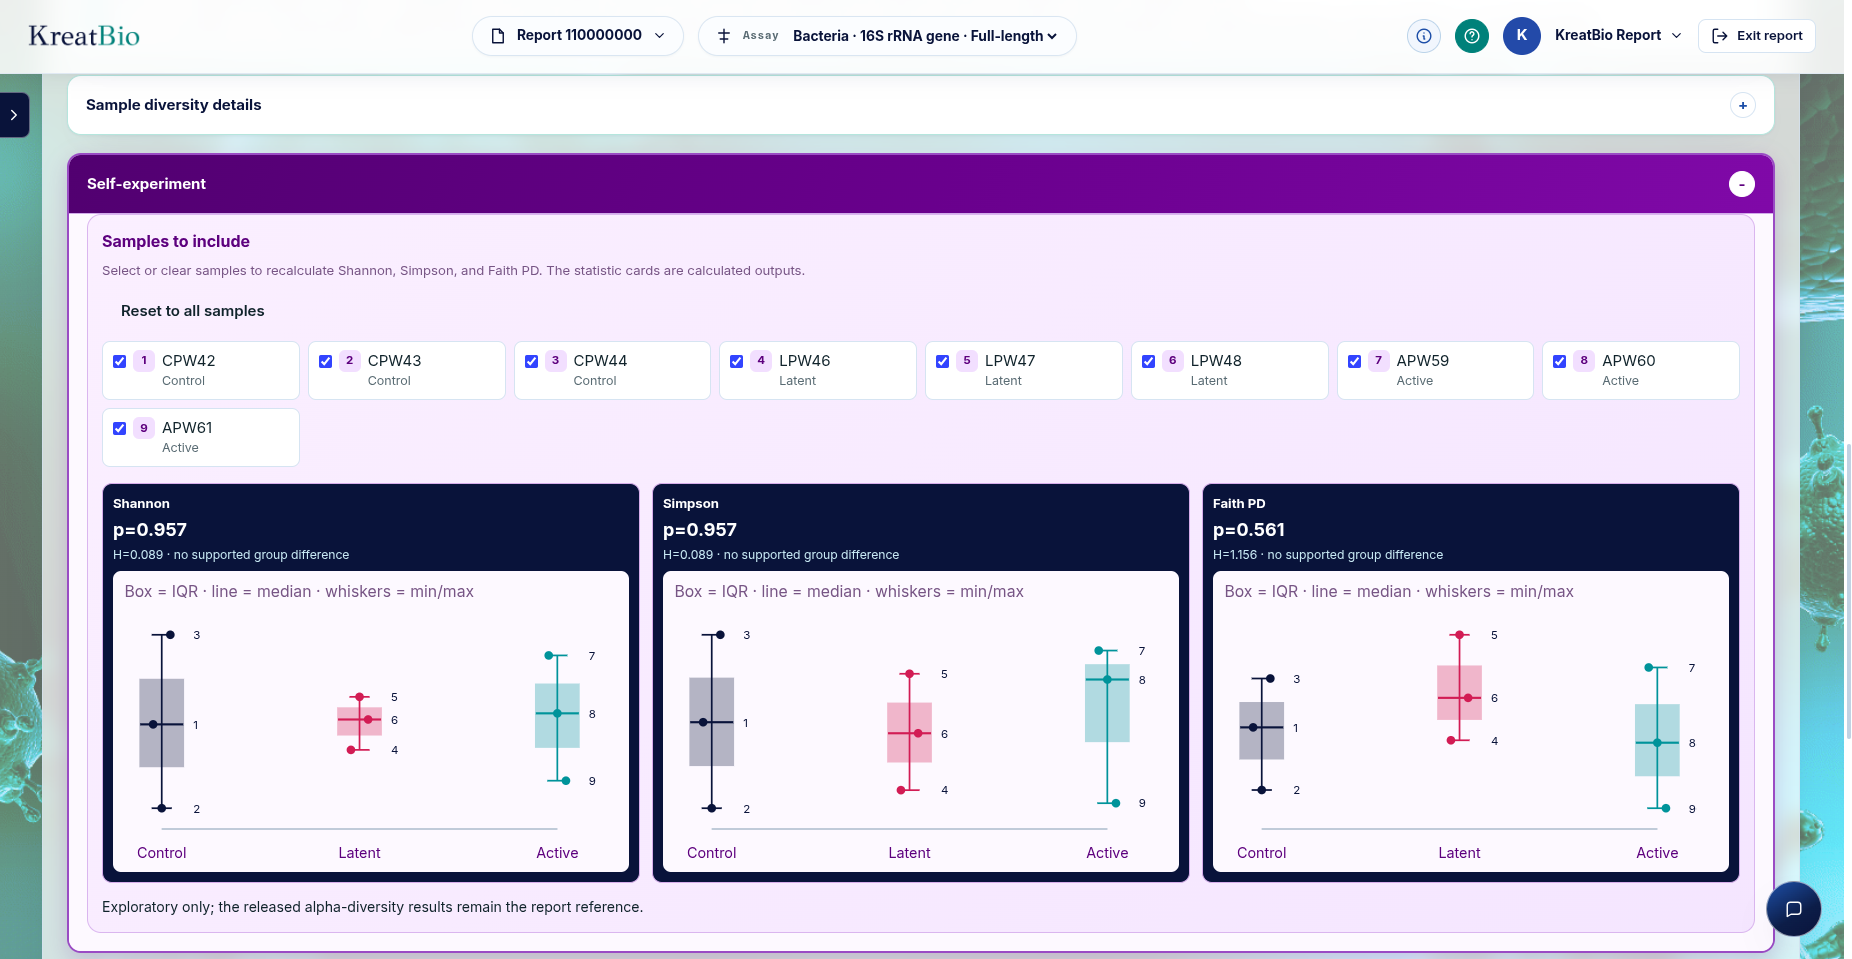
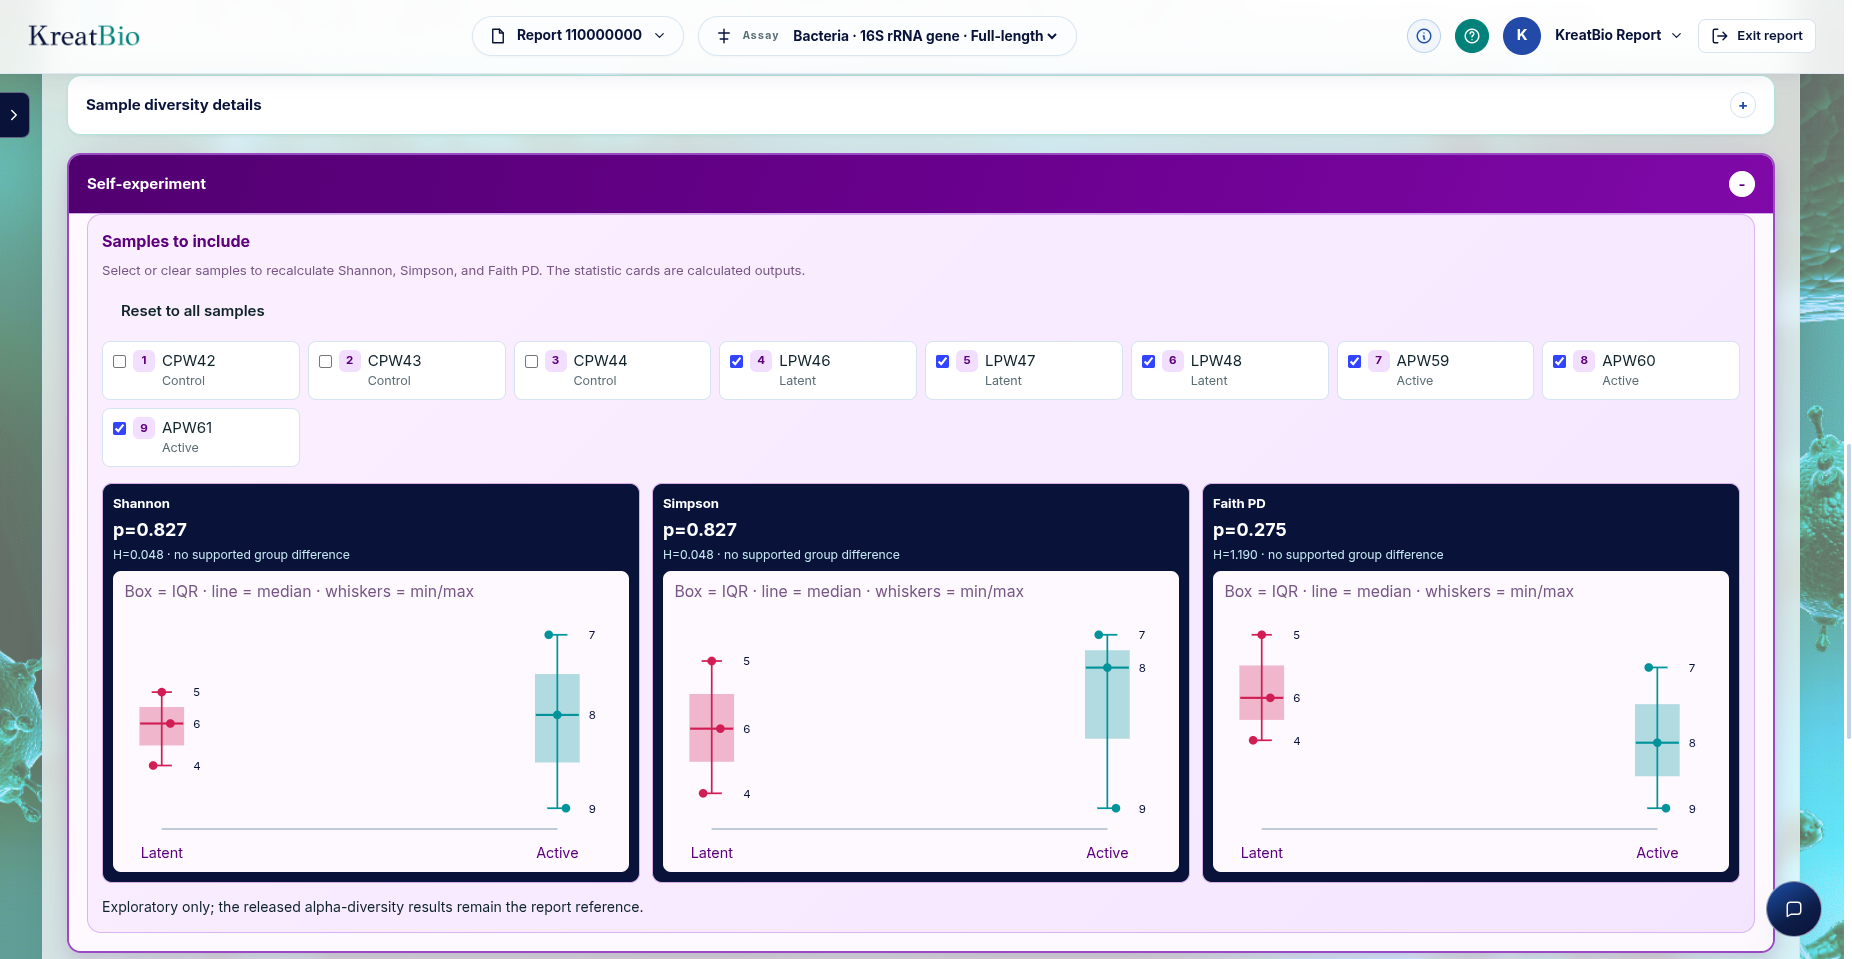
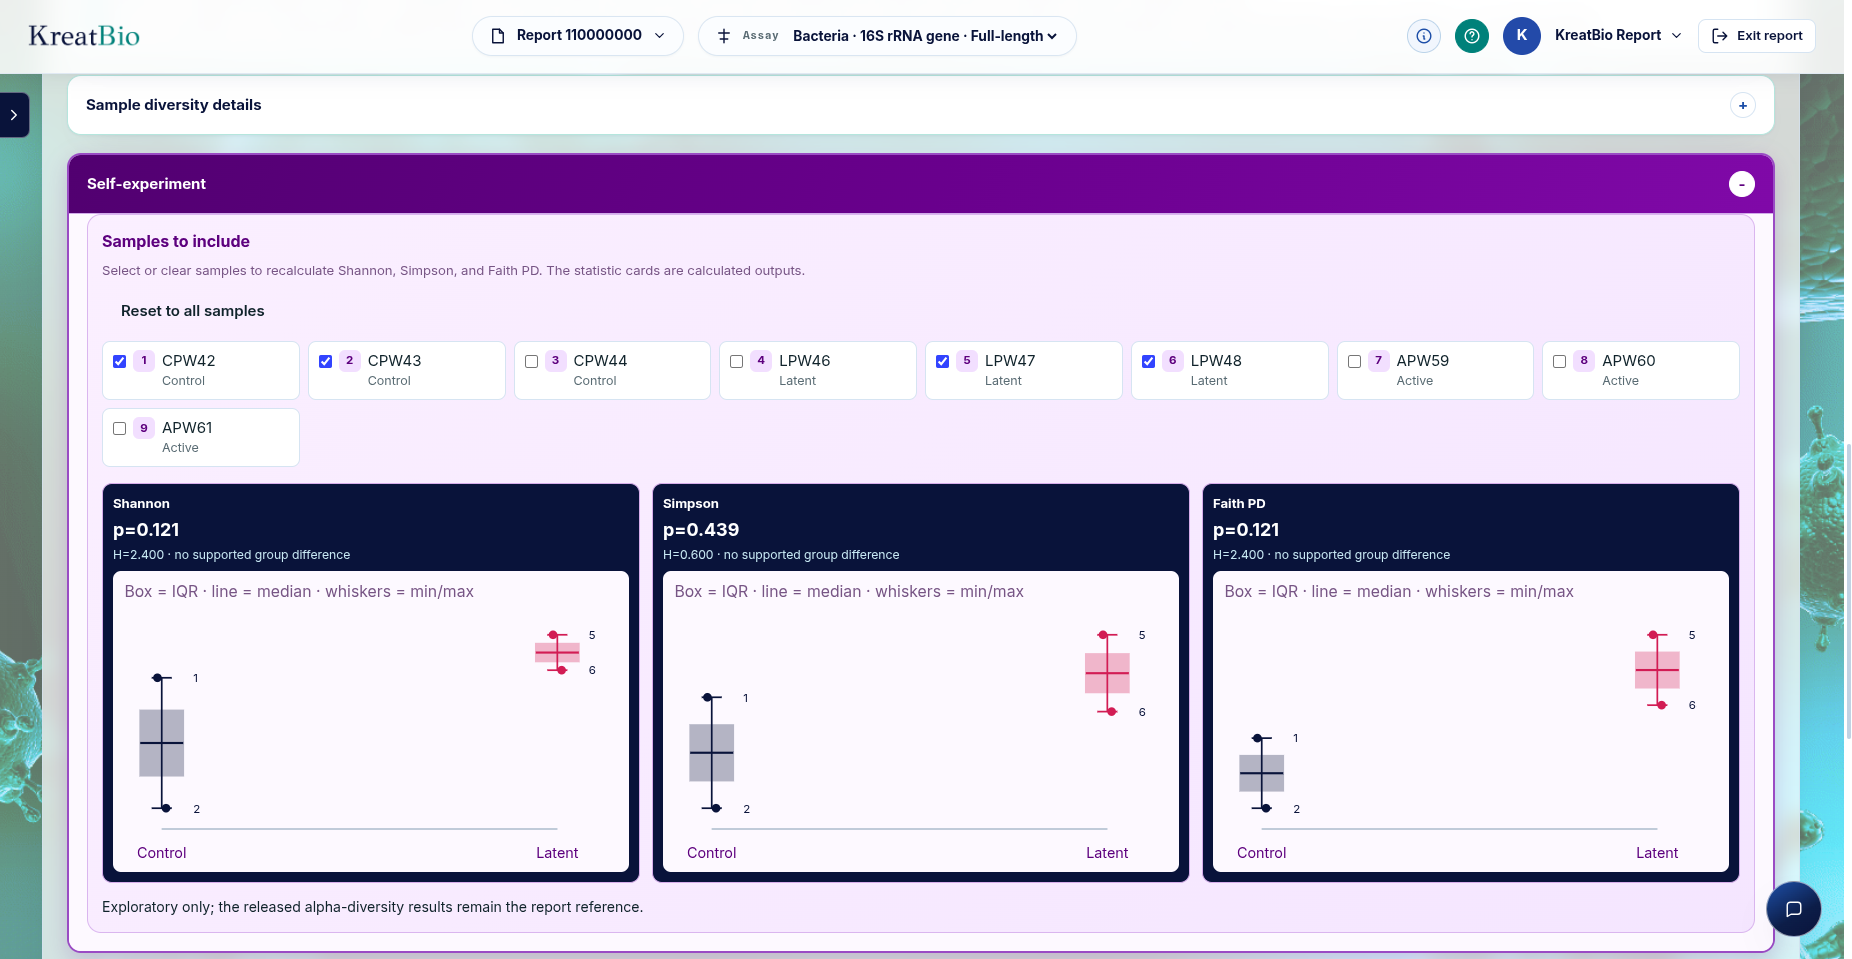
| Alpha diversity: Shannon | A diversity score that considers both richness and evenness. | It shows whether a sample has many microbes and whether they are balanced rather than dominated by one group. |
| Alpha diversity: Simpson | A diversity score focused on dominance. | It helps show whether a few microbes dominate the sample. |
| Alpha diversity: Faith PD | A diversity score that uses the evolutionary tree of the detected microbes. | It shows how phylogenetically broad the community is, not just how many names are present. |
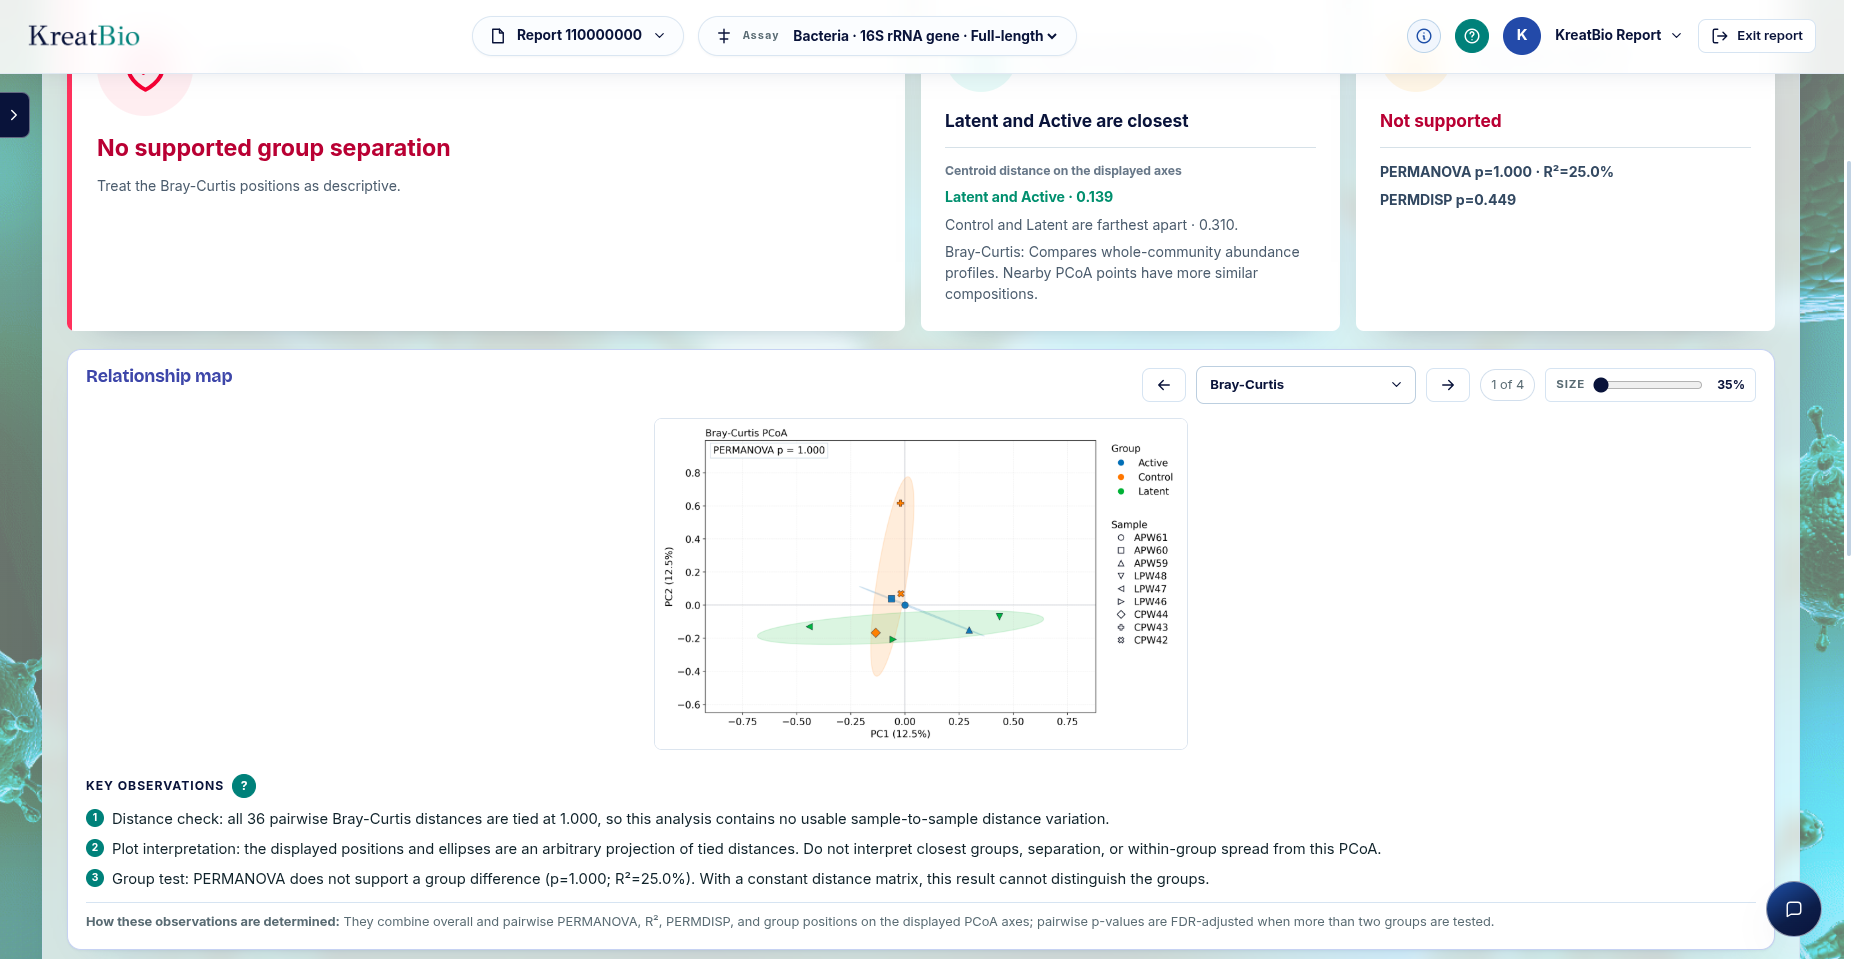
| Beta diversity: Bray-Curtis | A distance measure based on abundance differences between samples. | It shows whether two samples have different dominant community profiles. |
| Beta diversity: Jaccard | A distance measure based on presence or absence. | It shows whether two samples contain the same kinds of microbes, regardless of abundance. |
| Beta diversity: Unweighted UniFrac | A phylogenetic distance using presence or absence. | It shows whether samples contain different evolutionary groups of microbes. |
| Beta diversity: Weighted UniFrac | A phylogenetic distance that also includes abundance. | It shows whether samples differ in both evolutionary groups and how much of each group is present. |
| Beta diversity: PCoA plot | A 2D or 3D plot that places samples based on their beta diversity distances. | It makes sample clustering easy to see, such as whether treatment groups, sites, or time points have different microbial communities. |
| Functional prediction via PICRUSt2 | A prediction of likely gene functions from 16S profiles. | It provides an estimate of possible pathways, but it is not direct gene measurement like shotgun metagenomics. |
| Raw read QC | Summary of read quality, read count, base quality, and trimming results. | It confirms whether the sequencing data is clean enough for reliable analysis. |
| Sequencing depth | How many times, on average, each genome position is covered by reads. | Higher depth improves confidence in assembly, SNPs, and mutation calls. |
| Genome coverage | The percentage of the genome represented by sequencing reads or assembled contigs. | It shows whether the genome is mostly captured or has large missing regions. |
| Assembly statistics | Genome size, contig count, N50, GC content, and total assembled bases. | It gives a quick quality check of how complete and fragmented the assembly is. |
| Contamination check | A screen for mixed organisms or unexpected DNA in the sample. | It helps prevent wrong species ID, false gene calls, and misleading results. |
| MLST sequence type | A strain typing result based on standard housekeeping genes. | It helps compare isolates using a common public typing system. |
| Serotype or lineage | A predicted subtype or lineage, when supported by the organism and database. | It helps classify strains for epidemiology, surveillance, or outbreak context. |
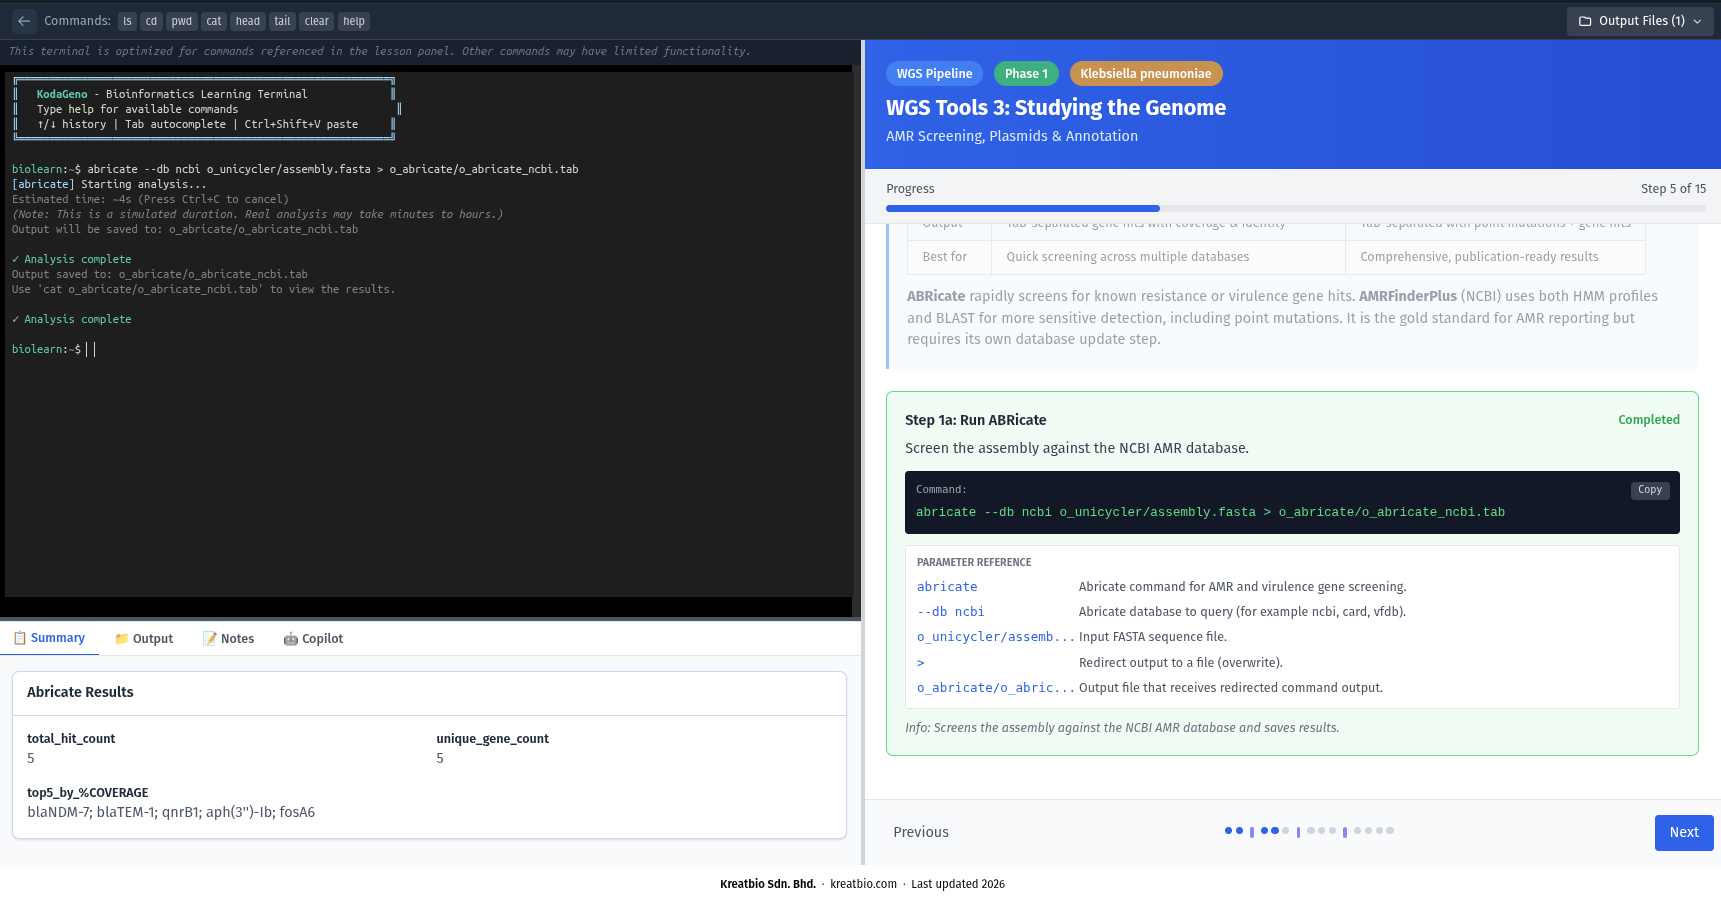
| AMR genes and mutations | Detected antimicrobial resistance genes and known resistance-associated mutations. | It helps predict possible resistance traits and supports screening decisions. |
| Virulence genes | Genes associated with pathogenicity, toxins, adhesion, invasion, or host interaction. | It helps estimate potential risk factors carried by the isolate. |
| Plasmid replicons | Markers showing likely plasmid types in the genome. | It helps identify mobile DNA that can carry AMR or virulence genes. |
| Mobile genetic elements | Prophages, insertion sequences, transposons, integrons, or related mobile regions. | It shows how genes may move between bacteria or change genome structure. |
| CRISPR arrays | Repeated immune-memory regions found in some bacterial genomes. | They can support strain comparison and provide clues about past phage exposure. |
| Phylogenetic tree | A tree showing how closely samples or isolates are related. | It helps visualise clusters, likely related isolates, and evolutionary distance. |
| Genome completeness | An estimate of how much expected single-copy marker content is present. | It helps judge whether a genome is complete enough for downstream interpretation. |